
🔍 Read the full analysis: Could This Twilight Dial Help AI Watch Noctilucent Clouds? on ThorstenMeyerAI.com

Get the latest gadgets delivered free with Prime
- Fast, free delivery on millions of items
- Prime Video, Amazon Music and more included
- Member-only deals all year
TL;DR
ThorstenMeyerAI.com describes “Noctilucent — NLC Watch at 83 km,” an AI-built exhibition website, not a real observing service. Its interactive dial changes the page’s simulated twilight lighting to illustrate how noctilucent clouds can remain sunlit after the ground is dark.
ThorstenMeyerAI.com has presented “Noctilucent — NLC Watch at 83 km,” an AI-built exhibition website that uses an interactive twilight dial to illustrate how high-altitude clouds can catch sunlight after night has fallen on the ground, as detailed in the original project analysis. The site is a fictional field journal, not a real company, observation network or live scientific service; the clouds it depicts are a real atmospheric phenomenon.
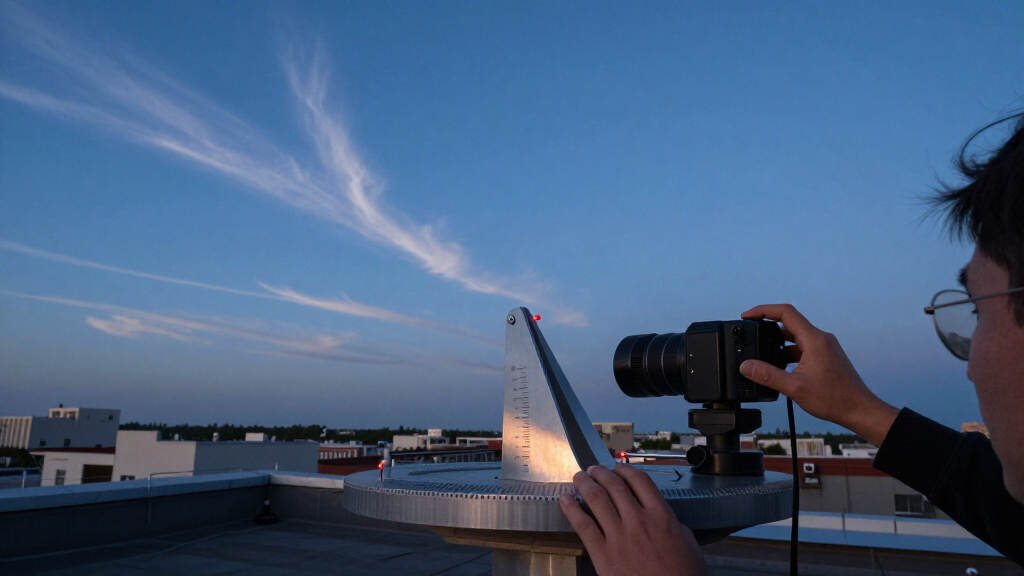
The dial represents the Sun’s position from six to 16 degrees below the horizon. Moving it changes several elements of the page’s simulated atmosphere, including sky brightness, shadow depth, cloud glow, ambient color, grain and horizon flare. The source describes the most expressive lighting state as occurring near 11 degrees below the horizon. These are features of the designed experience, not live measurements of the sky.
The page’s graphics are generated in the browser using Canvas, inline SVG and CSS, with no image assets, according to the supplied project description. Different cloud illustrations use distinct wave patterns, while diagrams and supporting text share the dial’s simulated lighting state. One exercise asks visitors to hold a control as ground-level haze fades and a cloud band at 83 kilometres becomes clearer; releasing early makes the simulated sighting fade.
The exhibition moves from a luminous horizon through cloud forms, ice-crystal formation and seasonal observation to an invented field log. Its design guide describes a three-pass process: build the working page, review it for clarity and interaction, then carry out an art-direction review. The source does not provide independent evaluations, visitor numbers or evidence that the page has been tested as a scientific teaching tool.
Atmosphere / Interactive Exhibit / Room 162 of 175
Could This Twilight Dial Help AI Watch Noctilucent Clouds?
A fictional field journal turns twilight geometry into a hands-on visual model. Its dial demonstrates how high-altitude ice clouds can remain sunlit after darkness reaches the ground.
01 / The central idea
One dial, a changing twilight
The control shifts the page’s simulated Sun position. Related visuals respond together so visitors can see the contrast between a dark ground and clouds still reached by sunlight.
Sky brightness, shadow depth, cloud glow, ambient color, grain and horizon flare. These are designed effects, not measurements of current atmospheric conditions.
02 / Reading the exhibit
Real phenomenon. Fictional watch.
Noctilucent clouds are real high-altitude ice clouds. The observing network, field journal and sighting exercise belong to the exhibition’s fictional scenario.
Clouds can catch sunlight
The exhibit explains how ice clouds high above the observer may remain illuminated after the lower sky and ground have darkened.
A visual explanation
The dial coordinates cloud forms, diagrams and page lighting. It illustrates an idea; it does not observe clouds or verify sightings.
Seasonal field journal
The brief imagines observers at high northern latitudes near the summer solstice. These details are part of the designed story.
03 / How the experience unfolds
From horizon to field log
The page connects its story and interactions through one simulated lighting state, then closes on an invented observing record.
Set the twilight scene and establish the light contrast.
Explore distinct wave patterns and the glowing cloud band.
Move through formation diagrams and a seasonal calendar.
Finish in the fictional station’s journal, not a real record.
The scene suggests haze fading as the observer’s sky darkens.
A cloud band at 83 km becomes clearer in the simulated exercise; releasing early fades the staged sighting.
04 / Built for the browser
Procedural visuals, designed behavior
The supplied project description says the exhibit creates its graphics in the browser and describes a three-pass design review.
Canvas · SVG · CSS
Graphics are described as browser-generated, with no image assets. Cloud illustrations use distinct wave patterns.
One shared light model
Diagrams and supporting text follow the dial’s simulated atmosphere, tying the experience to one meaningful variable.
Build · clarify · art-direct
The guide describes building the working page, reviewing clarity and interaction, then carrying out an art-direction review.
05 / Evidence check
What the source does not establish
The project material describes an exhibition concept and implementation. It does not document independent scientific or audience validation.
Live observations or forecasts
No live cloud measurements, operational forecasts, verified sightings, visitor numbers or independent technical review are reported.
Scientific teaching validation
The supplied material gives no independent assessment of scientific accuracy or evidence that the page has been tested as a teaching tool. Publication date and current site availability are also unspecified.
06 / Quick answers
Key questions
Keep the distinction clear: the clouds are real; the watch interface described here is an illustration.
Is NLC Watch at 83 km a real observing service?
No. The project calls it a fictional exhibition, not a company, observing network or live scientific service.
Are noctilucent clouds real?
Yes. They are high-altitude ice clouds that can remain sunlit after the ground below is dark.
Does the dial show current conditions?
No. It illustrates twilight lighting across 6–16 degrees of solar depression; it is not a weather instrument or forecast.
How are the visuals made?
The project description names browser-based Canvas, inline SVG and CSS graphics rather than image assets.
Turning Twilight Geometry Into Interaction
The project makes a real atmospheric contrast legible through a hands-on visual model: the observer is in darkness while clouds higher in the atmosphere may still receive sunlight. Instead of presenting that idea only in explanatory text, the page ties the illumination of its sky, diagrams and cloud forms to one control. This may help visitors understand why the clouds appear at night, while remaining an illustration rather than an observation.
That distinction matters for anyone encountering the page as a potential astronomy resource. The project description explicitly calls its observing network and field journal fictional. It offers a designed explanation and a simulated interface, not verified sightings, operational forecasts or scientific data. The source also says the experience supports reduced-motion settings and pauses animation when the browser tab is hidden, design choices that shape how the exhibit runs but do not establish scientific validity.
As an affiliate, we earn on qualifying purchases.
Real Clouds, Fictional Watch
Noctilucent clouds, also called NLCs, are real high-altitude ice clouds. The source describes them as remaining sunlit after the ground below has entered darkness. The exhibition places its cloud band at about 83 kilometres and builds its central interaction around the geometry of sunlight reaching high-altitude ice while the lower sky appears dark.
The fictional brief imagines observers near high northern latitudes and references a seasonal calendar around the summer solstice. Those details belong to the proposed website’s content and art direction; the supplied material does not establish them as findings from a real observing program. The work is listed as room 162 of 175 in a larger series, but the source gives no publication date or independent information about the other rooms.
““An AI-built exhibition piece: a fictional field journal for a fictional observing project, not a real company or live scientific service.””
— ThorstenMeyerAI.com project description
As an affiliate, we earn on qualifying purchases.
No Live Observations or Validation
The supplied material does not say when the site was published, provide a direct test of its scientific accuracy, or report how audiences have used it. Although it describes a build guide and the page’s implementation, it does not include independent technical review or measurements of performance. The fictional station logs and observing network should not be read as real records.
It is also unclear whether the live site is currently available or whether the described interface has changed since the source was written. The source refers readers to a live site but supplies no URL in the material provided here. No live cloud observations, forecasts or verification of sightings are documented.
astronomy lighting simulation tools
As an affiliate, we earn on qualifying purchases.
As an affiliate, we earn on qualifying purchases.
The Design Guide and Live Site
The project description points readers to the room’s live page and a design guide covering its lighting model, procedural graphics and animation behavior. The source does not specify a launch schedule, upcoming scientific work or a next milestone. Any further development should be understood as website or exhibition work unless its creators separately identify a real observational program.
As an affiliate, we earn on qualifying purchases.
Key Questions
Is NLC Watch at 83 km a real cloud-observation service?
No. The project description calls it an AI-built fictional exhibition, not a real company, observing network or live scientific service.
Are noctilucent clouds real?
Yes. The source identifies noctilucent clouds as real high-altitude ice clouds that can remain sunlit after the ground below is dark.
What does the twilight dial control?
It changes the page’s simulated lighting across a solar-depression range of six to 16 degrees below the horizon, affecting the sky, shadows, cloud glow and other visual details.
Does the dial show current atmospheric conditions?
No live measurements are described. The dial is an interactive illustration of the lighting idea, not a weather instrument or cloud forecast.
How are the website’s visuals made?
According to the project description, the page generates its graphics in the browser with Canvas, inline SVG and CSS, rather than using image assets.
Source: ThorstenMeyerAI.com
Fall Picks
fall essentials
As an affiliate, we earn on qualifying purchases.