📊 Full opportunity report: Bitcoin Battles Unfold in Live Warzone Visualization on ThorstenMeyerAI.com — validation score, market gap, and execution plan.
TL;DR
A groundbreaking web project visualizes Bitcoin trading as a live warzone, using real-time data to create an immersive, cinematic battlefield. It offers a new way to interpret market activity without providing trading signals.
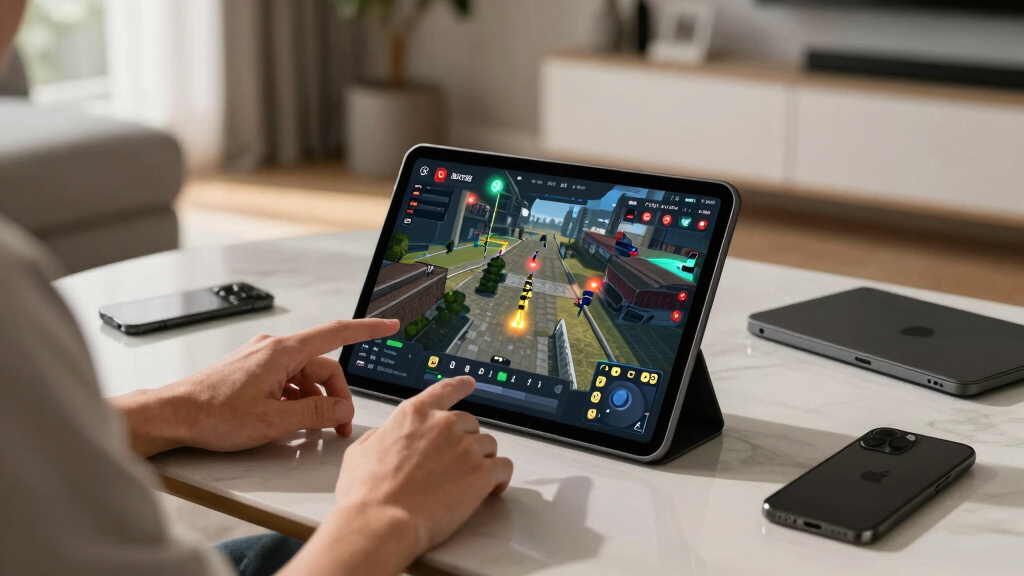
A new web-based visualization, called Bitcoin War, offers a real-time cinematic depiction of Bitcoin trading activity, turning market data into a visceral battlefield scene. Developed by isbitcoindead.com, this project connects directly to Binance and Coinbase streams, visualizing buy and sell orders as combatants in an ongoing war, with no trading advice involved. The visualization is accessible instantly in any modern browser, making it a unique intersection of technology, art, and financial data.
The visualization, available at war.isbitcoindead.com, leverages WebSocket connections to stream live BTC/USDT trades from Binance, with a fallback to Coinbase, ensuring continuous data flow. Each trade is visualized as a combatant—buy orders from the Cobalt Host push the front line from the left, while sell orders from the Ember Legion oppose from the right. Large liquidations are represented as airstrikes, adding a visceral element to the scene.
This project employs advanced browser technologies such as Canvas 2D graphics, WebAudio synthesis, and real-time stream processing, all without backend infrastructure. The system’s minimal footprint—around 180KB—demonstrates how sophisticated visualizations can be achieved client-side. An automatic camera shifts perspectives, alternating between broad views and detailed skirmishes, while a live DEFCON meter indicates market volatility. A scrolling log narrates ongoing market activity, and a browser-generated soundtrack heightens the tension. A comprehensive scoreboard tracks seconds won, casualties, and dollar-based territorial gains, creating a vivid narrative of market dynamics.
Importantly, Thorsten Meyer emphasizes that Bitcoin War is not a trading tool; it does not involve wallets, signals, or advice. Its purpose is artistic and data-driven, providing a visual representation of market chaos. The footer explicitly states: “a live reading of the BTC/USDT tape · no advice, only war.” The entire experience is free, requiring only a modern browser to explore this innovative intersection of finance and visual storytelling.
Why Visualizing Bitcoin as a Warzone Matters
This visualization offers a novel perspective on market activity, emphasizing the chaos, tension, and relentless tug-of-war between buyers and sellers. It provides viewers with an immersive experience that highlights market volatility and liquidity battles in a visceral way, potentially fostering a deeper understanding of trading dynamics beyond traditional charts. While primarily artistic, it also showcases the potential of advanced web technologies to create real-time, data-driven visual narratives, pushing the boundaries of how financial data can be experienced and interpreted.
Bitcoin trading visualization software
As an affiliate, we earn on qualifying purchases.
As an affiliate, we earn on qualifying purchases.
Background of Market Visualization Innovations
Traditional market analysis relies on charts, order books, and technical indicators, which can be abstract and difficult for some to interpret. Recent developments have explored more immersive visualizations, but few have combined real-time data with cinematic storytelling. The Bitcoin War project builds on this trend, utilizing browser-based graphics and stream processing to create an engaging, artistic representation of market activity. Launched recently, it reflects ongoing experimentation with data visualization in finance, emphasizing accessibility and immediacy.
“Bitcoin War transforms market data into a visceral battlefield, making the chaos of trading visually tangible.”
— an anonymous researcher
real-time cryptocurrency market monitor
As an affiliate, we earn on qualifying purchases.
As an affiliate, we earn on qualifying purchases.
Unconfirmed Aspects and Potential Limitations
It is not yet clear how accurately the visualization reflects real-time market conditions, or how it might influence viewers’ perceptions of trading risks. The project does not involve trading signals or advice, but its impact on viewer understanding remains to be studied. Additionally, the long-term stability of the data streams and compatibility across all browsers are still under observation, and the exact technical details of the visualization’s scalability are not publicly confirmed.
cryptocurrency market data display
As an affiliate, we earn on qualifying purchases.
As an affiliate, we earn on qualifying purchases.
Future Developments and Possible Expansions
Developers may enhance the visualization with additional features, such as more detailed analytics or interactive elements. There is also potential for integrating other market data or expanding to different cryptocurrencies. Monitoring user feedback and technical performance will guide future updates. As the project gains attention, it could inspire further artistic or educational applications of live financial data visualization.
Bitcoin live trading dashboard
As an affiliate, we earn on qualifying purchases.
As an affiliate, we earn on qualifying purchases.
Key Questions
Is Bitcoin War a trading platform?
No, Bitcoin War is an artistic visualization tool; it does not facilitate trading or involve wallets, signals, or investment advice.
How does the visualization work technically?
It connects directly to Binance and Coinbase trade streams via WebSocket, rendering data in real-time using browser technologies like Canvas 2D graphics and WebAudio, all client-side without backend infrastructure.
Can I customize or interact with the visualization?
Currently, Bitcoin War is designed as a passive visual experience with automatic camera shifts and no user interaction features. Future updates may include more interactivity.
Does this visualization accurately represent market conditions?
It provides a stylized, cinematic interpretation of trading activity, emphasizing chaos and conflict, but it is not a precise analytical tool.
Is this visualization available for free?
Yes, it is freely accessible in any modern browser at war.isbitcoindead.com.
Source: ThorstenMeyerAI.com